Descriptive Analysis of COVID-19 Cases
 Reem Al Raeai
Reem
|
منذ ٥ سنوات
Reem Al Raeai
Reem
|
منذ ٥ سنوات
رابط العمل
اطلب من Reem مشروعاً مماثلاً
أضف مشروعاً مماثلاً
معلومات العمل
| عدد الإعجابات |
٠ |
| عدد المشاهدات |
٩٠ |
| تاريخ الإنجاز |
منذ ٥ سنوات |
| تاريخ الإضافة |
منذ ٥ سنوات |
المهارات المستخدمة
شارك العمل
انسخ الرابط:
أو قم بمشاركته:
تفاصيل العمل
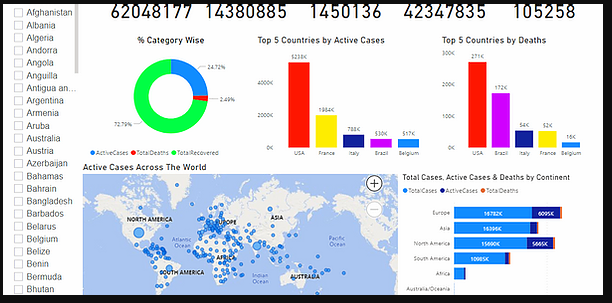
• Visualized descriptive analysis of COVID-19 across the world on 28-11-2020
• Downloaded the data from https://www.worldometers.info/coronavirus/ & cleaned the data using Power IB Query.
• Used Power BI Desktop to visualize the data.
• Created 5 cards, map, 2 column charts, stacked bar chart, pie chart, & slicer to show to show the total of cases, active cases, death, recovered, & serious cases for the countries & continents.
معلومات العمل
| عدد الإعجابات |
٠ |
| عدد المشاهدات |
٩٠ |
| تاريخ الإنجاز |
منذ ٥ سنوات |
| تاريخ الإضافة |
منذ ٥ سنوات |
صور من العمل